Command to take Heap Dump
jstat -gc <pid-of-memory-verification-program> 2000
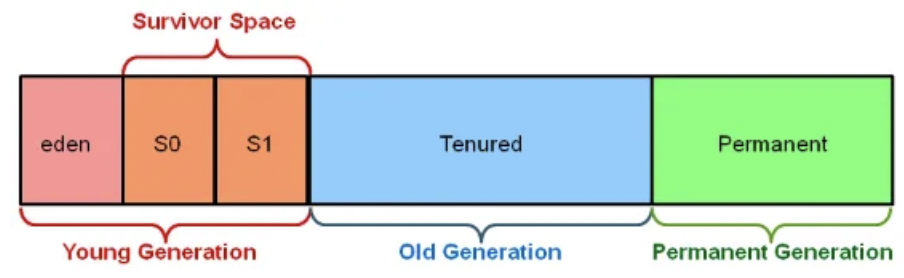
Young Generation It’s where new objects are initially placed Eden Space: This is where brand new objects go first when they are created. Its a part of young generation. Survivor Spaces (S0 and S1): objects from Eden Space that are still needed move to Survivor Spaces (S0 and S1). These spaces act like a waiting area for objects that are not too old. Old Generation Objects that have been around for a while and survived many garbage collection cycles move to the Old Generation. Its a spot for long lasting.
****Permanent Generation or Metaspace** which stored class metadata.
GC Algorithms: Serial Garbage Collector: This collector cleans up one thing at a time. It’s like doing chores one after another, and it’s good for smaller programs or single-threaded applications. Parallel Garbage Collector: This collector is like having a team of cleaners working together to pick up garbage. It’s faster because it uses multiple threads to clean up memory. CMS (Concurrent Mark-Sweep) Collector: It’s like cleaning up while the party is still going on. CMS tries to minimize pauses in your program by cleaning up memory while it’s still running.
G1 (Garbage First) Collector: G1 divides memory into small pieces and cleans them up in a smart way. It’s like sorting and cleaning up your room by sections, making it efficient for large applications.
Whats the challenge system can face if GC is happening frequently?
`Frequent GC is more than just a performance annoyance—it’s a symptom of memory pressure that, if unaddressed, will undermine both the throughput and predictability of your service.
Increased Latency (Stop‑the‑World Pauses)
-
Most collectors (even “concurrent” ones) still have moments where all application threads are paused to do root scanning, compaction, or other work. Throughput Degradation
-
CPU cycles devoted to GC are cycles not devoted to your application logic. As GC frequency rises, less CPU is available to service real work, so overall request throughput drops. High CPU Usage
-
A GC storm can peg the CPU, leaving little headroom for the application.
Memory Fragmentation & Promotion Failures
-
If you’re doing lots of allocation and de‑allocation, you can fragment the heap. This can trigger full GCs more often (to compact memory), creating a vicious cycle of more pauses. Increased Risk of Out‑Of‑Memory Errors
-
If GC can’t reclaim enough memory before the next allocation spike, you’ll hit OOM. Frequent GCs are often a warning sign that you’re operating at or above sustainable heap pressure.
Operational Complexity & Tuning Overhead
- Frequent GCs force you to spend more time tuning GC parameters, choosing different collectors (CMS vs G1 vs ZGC vs Shenandoah), resizing generations, etc.—all of which can be quite tricky in a production environment.
Mitigations
-
Reduce Allocation Rate:
Reuse objects (object pools), avoid excessive temporary allocations in hot paths. -
Tune GC Parameters:
Adjust heap size, young/gen sizes, pause‑time goals (e.g.-XX:MaxGCPauseMillisfor G1). -
Choose the Right Collector:
If you need very low pause times, consider low‑latency collectors like ZGC or Shenandoah (Java 11+). -
Profile and Diagnose:
Use tools likejstat, VisualVM, or commercial profilers to find allocation hotspots and tune accordingly. -
Off‑Heap or Alternative Caching:
For large caches or buffers, consider off‑heap storage (e.g. directByteBuffer, Chronicle Map) to reduce heap pressure.