- Fetch all vins ingestion within 30 days
- Fetch Vin History for 30 days
- Fetch Detail of given txnId
- fetch All TxnId history for 1 day fetch all vin with failed ingestion at any step with in 30 days
Old Capacity Estimates: Capacity estimates: Total vins: 10 lakh = 1M Total Audit event: 1M * 10 = 10M Audit event size : 800 Byte Total Size of Audit data = 800 * 10M Byte = 8000M Byte Audit data Size per day: 8000M Byte = 8M KB = 8 * 10^6 KB = 8000MB ~ 8 GB Per month audit data= 240GB
we were working on reducing event payload size by removing duplicate data and only keeping meta data, also not audting in case of replay.
New Adhoc Capacity estimates: total vins: 30 lakh = 3M total event: 30* 10 = 300 lakh = 30M
while resyncing and adding new inventory total events at audit service:
Event : 30~32M inventory/ day Total Audit event per day: 320M Audit event size : 800 Byte 1 inventory has avg 10 audit event Total Size of data = 800 * 10 * 30M new audit data per day
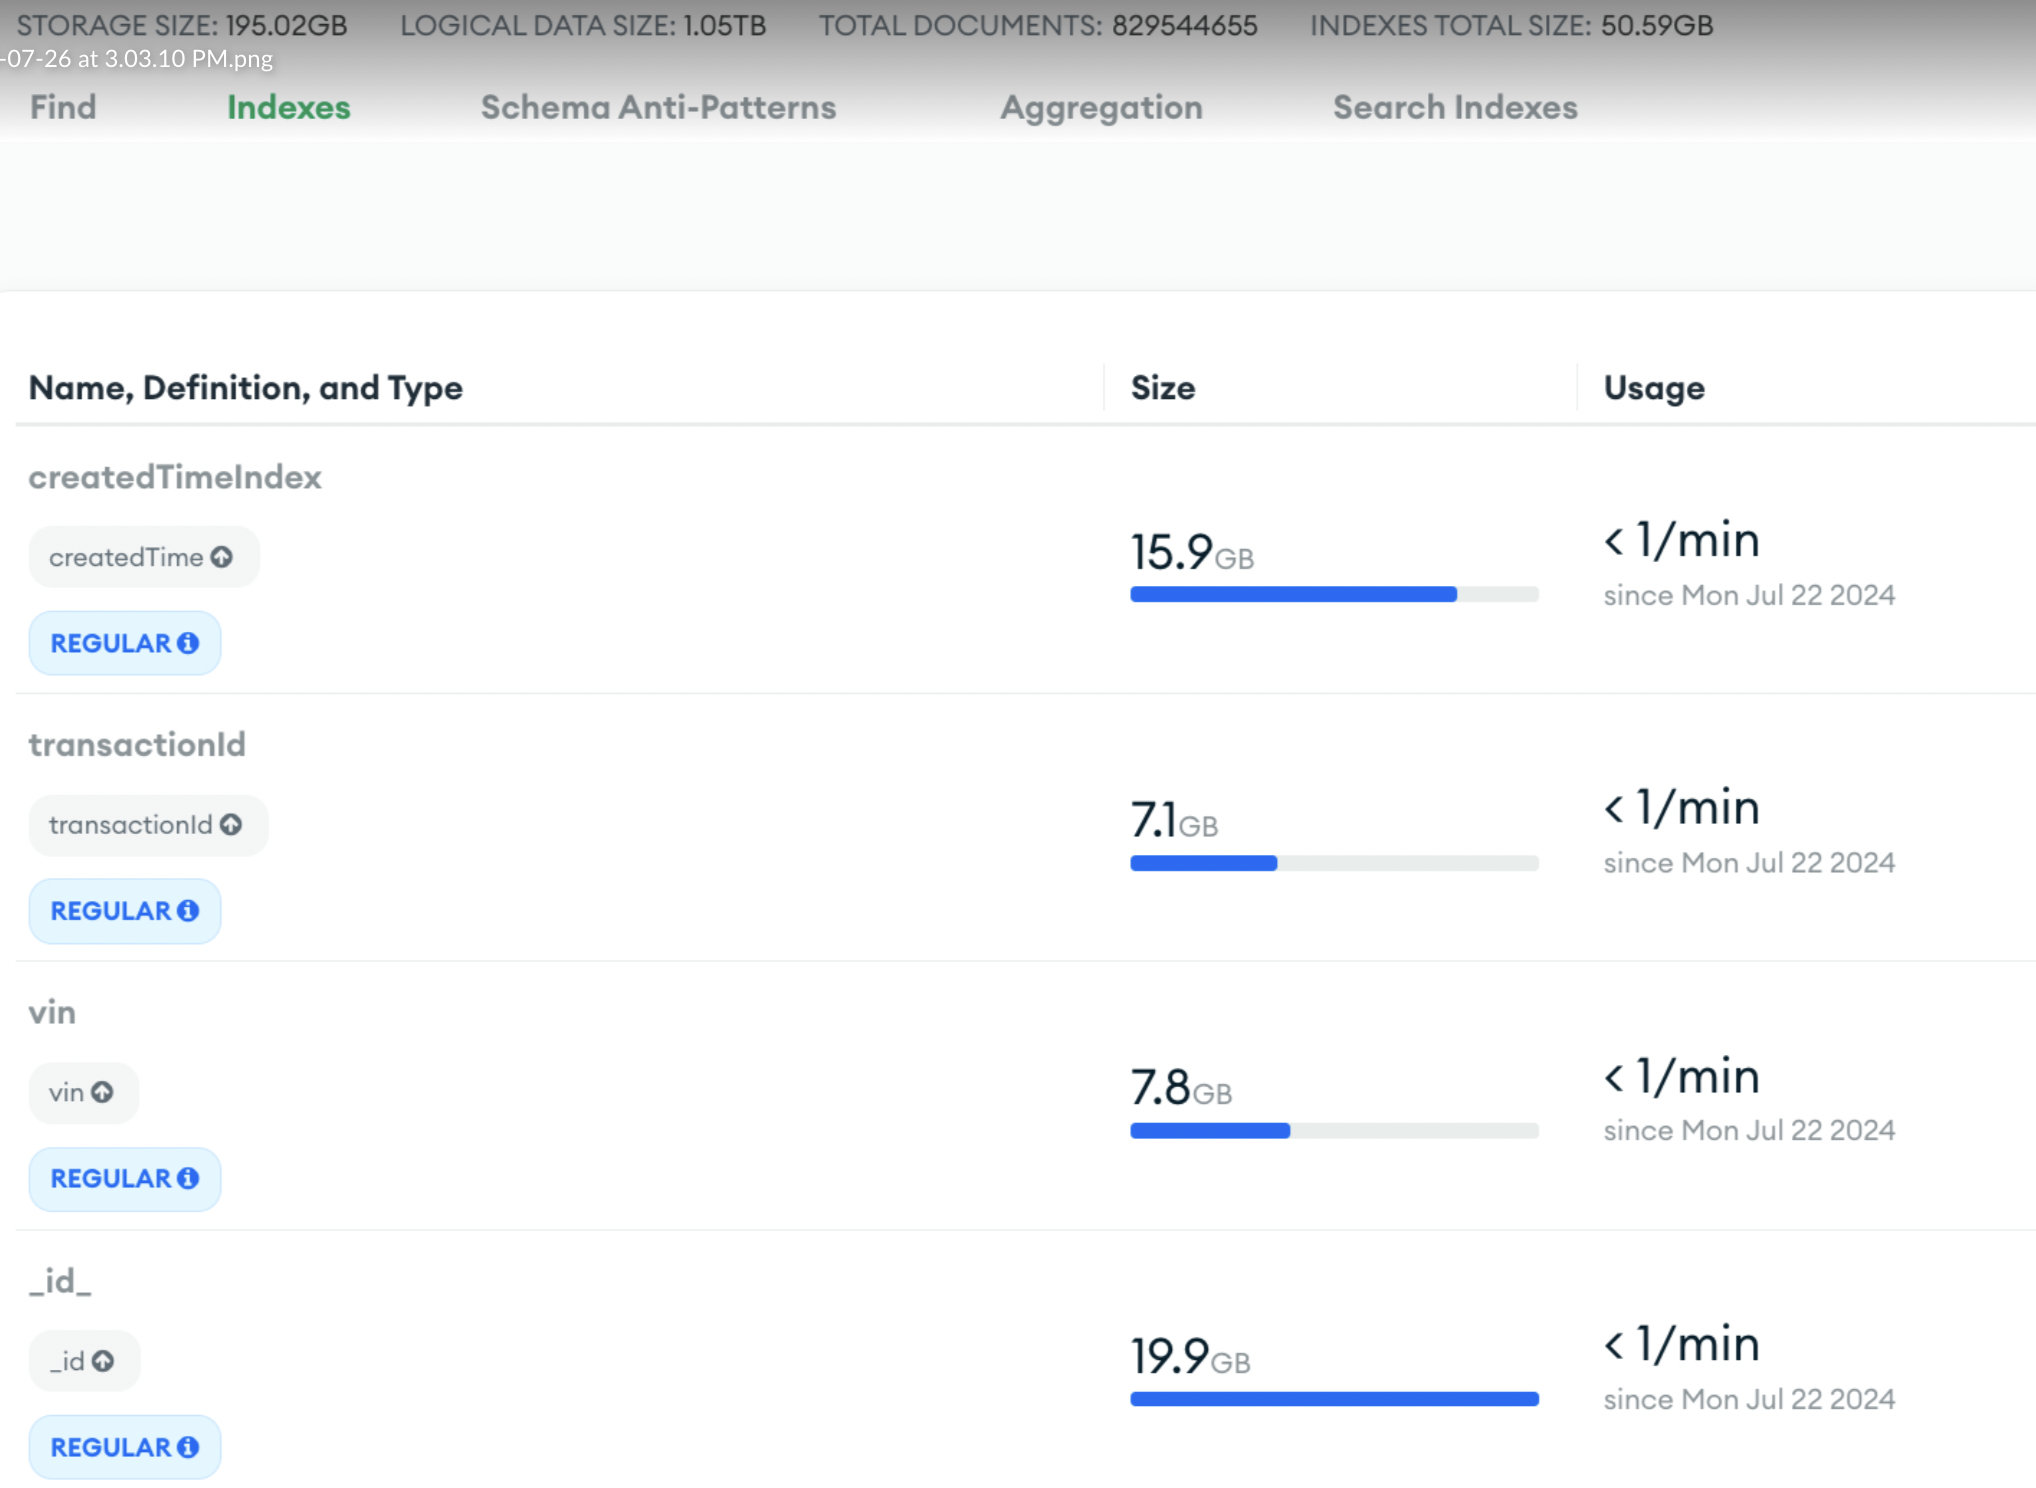
Indexes defind on created time to perform delete operation
- CreateTime
- TransactionId
- Vin
Problems:
index sizes:
 Even if your reads are using indexes, even loading index to RAM will take time
Total document currently → 811057370 storage size: 195GB Total size: 1.02TB Index Sie: 50GB
Problems :
Q: Actually it keeps autoscaling to M40 due to high CPU utilisation. Inserts in this collection are showing up to be consuming highest time/resources Ans: If your application is inserting large volumes of data at a high rate, the CPU might be overwhelmed by constant write operations.
- Batch Inserts: Instead of inserting one document at a time, use bulk operations (e.g.,
insertMany()in MongoDB). This reduces the overhead of multiple network calls and improves overall efficiency. - Having too many or inefficient indexes on a collection can significantly slow down insert operations because MongoDB has to update the indexes on each insert.
- Reduce Write Concern: If strong consistency isn’t critical, try lowering the write concern (e.g.,
w:1) to reduce the burden on the cluster. - MongoDB’s WiredTiger storage engine uses compression by default, which reduces disk I/O but can increase CPU utilization, especially for write-heavy workloads
Q: however, on the overall cost, I’m still doing some analysis. Looks like backup costs are very weird for this cluster. I’m still doing the analysis with support. Will let you know of my findings in a week or so. But it may be that this high write in audit DB is posing a cost issue Ans: When you delete large amounts of data from MongoDB but still notice that your backup costs remain high, several factors could be contributing to this issue. 1. Backups Retain Deleted Data Until Snapshot Expiry 2. Oplog Data in Continuous Backups 3. Data Fragmentation (WiredTiger Compression):Even after you delete data, space is not always immediately reclaimed in the database files. While this affects database size more than backup size, backups might include fragmented space depending on how the data is physically stored. 4. Old Backup Snapshots Still Stored 5. Inefficient Backup Strategy 6. Delayed Reflection of Data Deletions in Backups
Explore Other database suitable for this use case
For massive writes and bulk deletions with minimal costs and operational overhead, DynamoDB, Cassandra, and Google Bigtable are excellent options if you’re looking for managed solutions. If you prefer self-hosted solutions, ClickHouse, Cassandra, and ScyllaDB are worth considering.
ClickHouse
- Type: Columnar Database
- Best For: Analytical workloads, real-time analytics, and large bulk data management.
- Why Choose ClickHouse?
- Fast Writes: ClickHouse can handle large-scale insertions quickly, making it great for logging and event-driven workloads.
- Efficient Deletion via TTL: Offers the ability to manage data retention through TTL policies, automatically removing old data without the need for explicit bulk deletion queries.
- Cost: Being open-source, ClickHouse can be run on inexpensive infrastructure, keeping operational costs low. _Downside: Primarily optimized for read-heavy workloads, but write operations are still performant. Suitable for analytical use cases but may not be ideal for transactional use cases. -It is optimized for real-time analytics with a columnar storage format, providing quick query performance and analytics.
Understand more about ClickHouse DB
_**Click house vrs Cassendra for Audit service
- Both provide efficient read performance, but click house columnar data keeping provides better analytical query performance.
- Efficient write supported on click house
- Click house provide TTL for each entry
- Cassandra on the other hand is wide column database provide more promising write and read throughput
- Cassandra distributed storage and handling capability provides more advantage for write performance compared to MergeTree structure of click house.
- Cassandra provides rapid right.
- Click house columnar storage provide scope for data compression and faster query execution.
- both db provide liner scalability for the additional nodes
- open sources and perfect for dumping analytical and event driven data set
- Click house is more suitable for non transactional data
- Click house has query language similar to SQL
- Click house provides real time reports and dashboard.
- Click house offer real time insight to data
- Cassandra provides capabilities to handle massive volume data.
- Cassandra is an open-source project, click house cloud is managed services and cost on per use basis
- Click house support event data replication between nodes, Cassandra achieves fault tolerance through its distributed architecture, data replication to multiple nodes and data centers, ensuring zero data loss _ClickHouse shines in real-time analytics, big data processing, and event-driven applications, while Cassandra excels in scenarios requiring high scalability, availability, and write throughput
Improved version of Audit service as vin visibility platform
Elastic Search: Optimised Elastic search GC for audit, as due to frequent events lots new entries of audit was getting created, deletion cron has to removed older entries after 5 subsequent updates. this deletion resulted in more segmentation merge due to higher deletion rate. Streamliined elastic search segment merge process with below setps. Optimization to Mitigate GC Impact:
- Tune Merge Policies:
- Use Elasticsearch’s
index.merge.policysettings to control when and how merges occur (e.g., max segment size, number of segments to trigger a merge). ran it after cron job was ran.
- Use Elasticsearch’s
- Monitor Heap Usage:
- Ensure the heap size is sufficient to handle memory-intensive merge operations.
- Use SSDs:
- Faster disks reduce the time spent in I/O operations, minimizing the strain on the JVM.
- Adjust Threadpool Settings:
- Configure the merge thread pool to control the number of concurrent merges, preventing excessive resource contention. after cron was run quick merge and deletion was needed to increased threadpool size.
_**Insight tool:
_The audit system’s rich data model and ClickHouse’s analytical capabilities enable diverse tech/business insights across multiple dimensions:
1. Activity-Based Analytics
- Volume and patterns of activities by type
- Success/failure rates of operations
- Peak activity periods and operational trends
2. Flow Analysis
- End-to-end business flow completion rates
- Flow bottleneck identification
- Process efficiency metrics
- Average completion time for business flows
3. User/System Behavior
- User interaction patterns
- System usage analytics
- Session-based user journey analysis
- Actor performance metrics
4. Entity State Analysis
- Object lifecycle tracking
- Change frequency analysis
- Impact analysis of changes
- Configuration drift detection
5. Operational Intelligence
- Error pattern detection
- Performance bottleneck identification
- Resource utilization patterns
The system supports both real-time monitoring and historical trend analysis, enabling data-driven operational decisions._
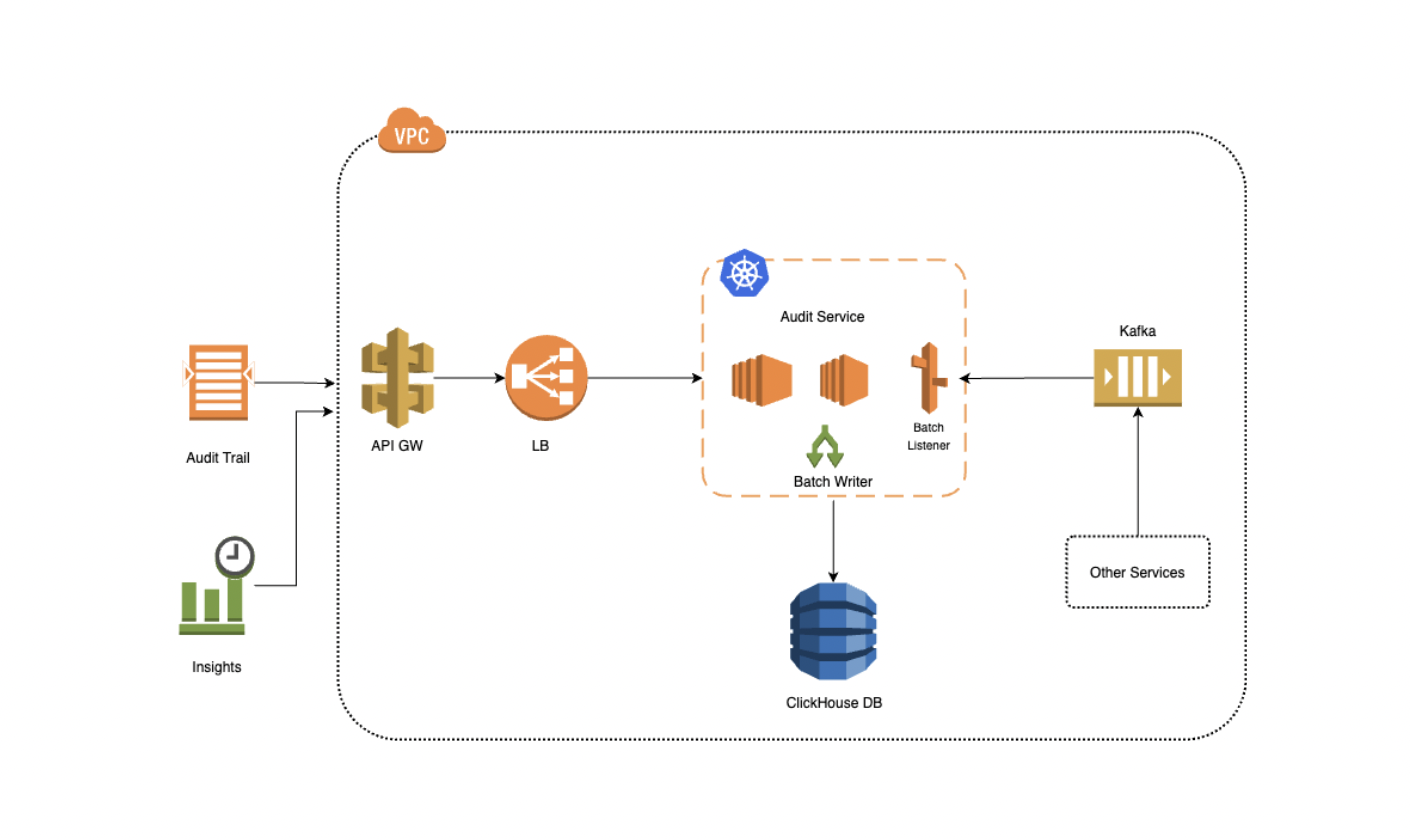
A scalable audit system designed to capture and process audit activities across multiple services. The system uses Kafka for reliable event streaming and ClickHouse for efficient storage and analytics.
Architecture Components:
-
Event Generation
- Microservices emit audit activities
- Standardized event schema across services
- Events pushed to dedicated Kafka topics
-
Event Processing Pipeline
- Kafka: Acts as event buffer and ensures reliable delivery
- Batch Consumer: Processes events in configurable batch sizes
- Batch Writer: Optimized bulk writes to ClickHouse
-
Storage Layer
- ClickHouse DB: Optimized for audit analytics
- Flat table structure for better query performance
- Partitioning by month (TBD) for efficient data management
-
Query Layer
- REST APIs exposed through API Gateway
- Supports audit trails and insights
- Optimized query patterns for common use cases
 _**Events Structures:
{
  "id": "uuid",
  "activity_id": "string",
  "timestamp": "datetime",
  "event_date": "date",
  "activity_type": "string",
  "activity_group": "string",
  "activity_status": "string",
  "activity_sequence": "number",
  "parent_flow": {
    "type": "string",
    "group": "string",
    "correlation_id": "string"
  },
  "target_flow": {
    "type": "string",
    "group": "string",
    "correlation_id": "string"
  },
  "entity": {
    "id": "string",
    "type": "string",
    "before_value": "json-string",
    "after_value": "json-string"
  },
  "context": {
    "key": "string"
  },
  "actor": {
    "id": "string",
    "id_type": "string",
    "actor_type": "string",
    "name": "string",
    "role": "string",
    "context": {
      "ip": "string",
      "session_id": "string"
    }
  },
  "metadata": {
    "environment": "string",
    "trace_id": "string",
    "partner_id": "string",
    "program_id": "string",
    "website_id": "string"
  }
}
Sample Event: for LEAD_REQUEST_RECEIVED
  "id": "system-generated",
  "activityId": "100",
  "timestamp": "2024-12-12T10:00:00Z",
  "event_date": "2024-12-12",
  "activityType": "LEAD_REQUEST_RECEIVED",
  "activity_group": "LeadWorkflow",
  "activity_status": "SUCCESS",
  "activity_sequence": 1,
  "parent_flow": {
    "type": "WEB_LEAD_REQUEST",
    "group": "Submission",
    "correlation_id": "REQ_ID"
  },
  "target_flow": {
    "type": "LEAD_PROCESSING",
    "group": "LeadManagement",
    "correlation_id": "LeadId"
  },
  "entity": {
    "id": "REQ12345",
    "type": "LeadRequest",
    "after_value": "{\"leadDetails\": \"Initial lead request data\"}"
  },
  "actor": {
    "id": "USER001",
    "id_type": "USER",
    "actor_type": "CUSTOMER",
    "name": "Jhon",
    "role": "CONSUMER",
    "context": {
      "ip": "192.168.1.1",
      "session_id": "SESSION123"
    }
  },
  "metadata": {
    "environment": "Production",
    "trace_id": "TRACE100",
    "partner_id": "PARTNER001",
    "program_id": "PROGRAM001",
    "website_id": "WEBSITE001"
  }
}
***Click House Schema
Key Design Decisions:
- Flat structure chosen over nested for better query performance and simpler maintenance
- Correlation IDs link activities across different flows
- Entity state changes captured as before/after values for comprehensive audit trails
CODEC. is compression algorithm
UUID is a 16-byte (128-bit)
LowCardinality is excellent for columns with a limited number of distinct string values (e.g., “Login”, “OrderCreated”, “InventoryAdjusted”). It stores distinct values in a dictionary and uses integers to reference them, significantly saving space and speeding up queries.
CODEC(ZSTD(1)): Specifies the ZSTD compression algorithm with compression level 1.
event_date Date MATERIALIZED toDate(timestamp) timestamp DateTime64(3) CODEC(DoubleDelta): millisecond precision (3 decimal places) and A compression codec particularly effective for monotonically increasing numeric values (like timestamps). It stores differences between consecutive values, then differences of those differences, leading to high compression ratios event_date Date MATERIALIZED toDate(timestamp): This means the event_date column is not explicitly inserted; its value is automatically calculated (MATERIALIZED) from the timestampcolumn using thetoDate()function when data is written.PARTITION BY toYYYYMM(event_date): Organise data into partition like '202401', '202402'. parition on month provides Efficient Data Management and efficient queries. _**Ordering Key (Primary Index):**_ORDER BY (event_date, parent_flow_correlation_id, target_flow_correlation_id, entity_id, activity_sequence)`
CREATE TABLE activities
(
    -- Primary Identifiers
    id UUID DEFAULT generateUUIDv4(),
    activity_id LowCardinality(String) CODEC(ZSTD(1)),
    timestamp DateTime64(3) CODEC(DoubleDelta),
    event_date Date MATERIALIZED toDate(timestamp),

    -- Activity Classification (frequently filtered fields)
    activity_type LowCardinality(String) CODEC(ZSTD(1)),
    activity_group LowCardinality(String) CODEC(ZSTD(1)),
    activity_status LowCardinality(String) CODEC(ZSTD(1)),
    activity_sequence UInt16 CODEC(DoubleDelta, LZ4),

    -- Flow Information (flattened for better querying)
    parent_flow_type LowCardinality(String) CODEC(ZSTD(1)),
    parent_flow_group LowCardinality(String) CODEC(ZSTD(1)),
    parent_flow_correlation_id String CODEC(ZSTD(1)),

    target_flow_type LowCardinality(String) CODEC(ZSTD(1)),
    target_flow_group LowCardinality(String) CODEC(ZSTD(1)),
    target_flow_correlation_id String CODEC(ZSTD(1)),

    -- Entity Information
    entity_id String CODEC(ZSTD(1)),
    entity_type LowCardinality(String) CODEC(ZSTD(1)),
    entity_before_value String CODEC(ZSTD(3)), -- JSON string
    entity_after_value String CODEC(ZSTD(3)),  -- JSON string

    -- Context as JSON
    context String CODEC(ZSTD(3)),

    -- Actor Information (flattened for query performance)
    actor_id String CODEC(ZSTD(1)),
    actor_id_type LowCardinality(String) CODEC(ZSTD(1)),
    actor_type LowCardinality(String) CODEC(ZSTD(1)),
    actor_name String CODEC(ZSTD(1)),
    actor_role LowCardinality(String) CODEC(ZSTD(1)),
    actor_ip String CODEC(ZSTD(1)),
    actor_session_id String CODEC(ZSTD(1)),

    -- Metadata
    metadata_environment LowCardinality(String) CODEC(ZSTD(1)),
    metadata_trace_id String CODEC(ZSTD(1)),
    metadata_partner_id String CODEC(ZSTD(1)),
    metadata_program_id String CODEC(ZSTD(1)),
    metadata_website_id String CODEC(ZSTD(1))
)
ENGINE = ReplacingMergeTree()
PARTITION BY toYYYYMM(event_date)
-- Optimized ORDER BY for common query patterns
ORDER BY (event_date, parent_flow_correlation_id, target_flow_correlation_id, entity_id, activity_sequence)
SETTINGS
    index_granularity = 8192,
    enable_mixed_granularity_parts = 1;
Index: (Secondary indexes creation)
In addition to the primary index defined by ORDER BY, ClickHouse allows you to define secondary data skipping indexes. These indexes store aggregated information about data blocks, enabling ClickHouse to skip entire blocks of data during queries if they don’t contain the requested values. This significantly speeds up queries that filter on these indexed columns, especially when they are not part of the primary ORDER BY key.
TYPE bloom_filter: A Bloom filter is a probabilistic data structure that can quickly tell you if an element might be in a set, or if it’s definitely not in a set.
idx_parent_correlation parent_flow_correlation_id:
- Significance: While
parent_flow_correlation_id(txn id or vin)is part of theORDER BYkey, adding a Bloom filter index on it can still provide benefits, especially forWHEREclauses that filter on this column. It allows ClickHouse to quickly determine if a data block might contain a specificparent_flow_correlation_idbefore reading the entire block. This is crucial for quickly isolating events related to a particular business flow
ALTER TABLE activity_events
    -- Correlation ID lookups (covers both parent and target)
    ADD INDEX idx_parent_correlation parent_flow_correlation_id TYPE bloom_filter GRANULARITY 1,
    ADD INDEX idx_target_correlation target_flow_correlation_id TYPE bloom_filter GRANULARITY 1,

    -- Entity lookups
    ADD INDEX idx_entity_id entity_id TYPE bloom_filter GRANULARITY 1,
    ADD INDEX idx_entity_type entity_type TYPE bloom_filter GRANULARITY 1,

    -- Activity type and status lookups
    ADD INDEX idx_activity_type activity_type TYPE bloom_filter GRANULARITY 1,
    ADD INDEX idx_activity_status activity_status TYPE bloom_filter GRANULARITY 1,

    -- Actor lookups
    ADD INDEX idx_actor_id actor_id TYPE bloom_filter GRANULARITY 1,
    ADD INDEX idx_actor_role actor_role TYPE bloom_filter GRANULARITY 1;
# Query Patterns and Materialised Views
ClickHouse Materialized Views provide a mechanism to transform and aggregate audit data in real-time as it’s being inserted into the main audit_events table. Unlike traditional databases, ClickHouse materialized views are insert-only and maintain their own storage using specific table engines (like SummingMergeTree, and AggregatingMergeTree).
Key Benefits:
- Automatic real-time aggregation during data ingestion
- No additional processing overhead during read operaions
- Optimized storage for analytical queries using specialized engines
- Efficient for high-cardinality audit data processing
Trade-offs:
- Additional storage space as views maintain separate tables
- Views are updated only during inserts (not updates/deletes)
- Need careful consideration of aggregation logic as modifications require view recreation
Here are several examples of materialized views that can be utilized for frequently encountered audit trail queries.
- Correlation-based Flow Trails:
Handles both parent and target correlations, groups by flow type
CREATE MATERIALIZED VIEW mv_correlation_trails
ENGINE = ReplacingMergeTree()
PARTITION BY toYYYYMM(event_date)
ORDER BY (event_date, correlation_id, flow_type, activity_sequence)
AS
WITH
correlations AS (
    -- Collect all related correlation IDs
    SELECT DISTINCT
        event_date,
        parent_flow_correlation_id AS correlation_id
    FROM activity_events
    WHERE parent_flow_correlation_id IS NOT NULL
    UNION ALL
    SELECT DISTINCT
        event_date,
        target_flow_correlation_id
    FROM activity_events
    WHERE target_flow_correlation_id IS NOT NULL
)
SELECT
    event_date,
    flow_type,
    if(parent_flow_correlation_id = correlation_id, parent_flow_type, target_flow_type) AS flow_type,
    correlation_id,
    activity_sequence,
    activity_type,
    activity_status,
    entity_id,
    entity_type,
    entity_before_value,
    entity_after_value,
    actor_id,
    actor_name,
    context
FROM activity_events
JOIN correlations USING (correlation_id, event_date);
User Activity Trail
CREATE MATERIALIZED VIEW mv_user_activities
ENGINE = ReplacingMergeTree()
PARTITION BY toYYYYMM(event_date)
ORDER BY (event_date, actor_id, flow_type, timestamp)
AS SELECT
    event_date,
    actor_id,
    actor_name,
    actor_role,
    flow_type,
    activity_type,
    activity_status,
    entity_id,
    entity_type,
    parent_flow_correlation_id,
    target_flow_correlation_id,
    timestamp
FROM activity_events
WHERE actor_type = 'USER';
cassandra is costly than click house managed
Infra and Storage requirements:
- Ingestion Rate: 10M events/day.
- 10,000,000 events / 24 hours / 3600 seconds = ~115 events/second
- Peak ingestion could be significantly higher (e.g., during specific hours). You need to estimate your peak RPS (requests per second).
- Event Size: 1-3KB. Let’s assume an average of 2KB.
- Daily data volume: 10M events * 2KB/event = 20 GB/day raw data. Data Compression: ClickHouse excels at compression. 5x to 50x compression. 2-4GB compressed data.
Query Patterns: all entries for given corelation id. all updates for given vins. ad-hoc queries to find all failed vin while fetch pricing details failed vins while sending update to OMS.
2 shards: 2 replics 4 vCPU, 32 GiB RAM, with 1-1.5 TB provisioned SSD storage
Replication: Multi-Master Asynchronous Replication. Data Ingestion: You can insert data into any replica of a shard. The data is first written locally and then asynchronously copied to other replicas within the same shard. Fault Tolerance: If a replica fails, queries can be routed to other healthy replicas in the shard, ensuring high availability. Writes can continue to any available replica.
Elasticity with Managed Services: Managed ClickHouse services offer features like:
- Auto-scaling: Automatically adjust compute resources based on workload.
- Tiered Storage: Automatically move older, less frequently accessed data to cheaper object storage (like S3), freeing up expensive local SSDs for hot data.
- Simplified Operations: The provider handles infrastructure provisioning, patching, backups, and monitoring, allowing you to focus on your application.
- Automated Failover: Managed services typically include automated failover mechanisms. If a primary replica fails, a healthy replica is promoted to ensure continuous operation.
-
- Backups and Disaster Recovery: Managed services provide automated backups and disaster recovery capabilities, allowing you to restore your data in case of catastrophic failures.
- Monitoring and Alerting: Comprehensive monitoring by the managed service helps detect issues early and ensures proactive intervention.
- Efficient Data Rolling/Archival: You can easily drop old partitions (e.g.,
ALTER TABLE my_table DROP PARTITION 'YYYYMM') or move them to cheaper storage without affecting active data.
Cardinality: Monthly partitioning has low cardinality (12 partitions per year), which is ideal for ClickHouse. Avoid overly granular partitioning (e.g., by day if you have many events per day, or by a high-cardinality ID) as it can lead to too many small parts and reduce performance.
if the load increases by 2X, what will happen and how to handle?
_CPU Starvation:
- Higher event rates mean
more CPU cycles for parsing, compression, and writing dataparts.More concurrent queries, or more complex queries, will demand significantly more CPU for aggregation, filtering, and joins. Merges also consume CPU.High CPU utilization across all nodes, slow query response times, increased ingestion latency, backlog of unmerged parts. RAM Exhaustion: Increased buffer usage for incoming data. Out-of-memory errors, queries failing, significant slowdowns due to increased disk I/O as data is swapped to disk or less data is cached. Disk I/O Bottlenecks: More data written to disk, more frequent small parts created. ClickHouse constantly merges small parts into larger ones in the background.
Network Bandwidth Saturation: Network bottlenecks, slow data transfer, increased latency.
The Kafka consumers might struggle to process events fast enough, leading to increased consumer lag in Kafka if not properly scaled. Dictionary/View Refresh Issues: If you use external dictionaries or materialized views, their refresh cycles might struggle to keep up or become resource-intensive. Increase the number of consumer instances. Optimize your ClickHouse inserts from your consumers. Batch inserts are significantly more efficient than single-row inserts. Increase batch sizes if your application can handle the memory.
Auto scaling functionality: Ensure your managed service has robust auto-scaling capabilities configured. Horizontal Scaling (Preferred for 2x Load): Add more nodes (shards and/or replicas). This distributes the load and storage. Increase Number of Shards
- During the 2x Load (and always): Set up alerts for:
- High CPU utilization (e.g., >80% sustained).
- High RAM utilization (e.g., >85%).
- High disk I/O wait times or saturated IOPS.
- Increasing number of ClickHouse parts.
- Increasing Kafka consumer lag.
- Slow query performance.
- This allows you to react quickly if performance degrades despite your provisioning.